Data in News

How journalists use data in their reporting or in their writing can be viewed as a reflection of the country’s demand for statistics and data. The report team, in partnership with the Society of Economic Journalists-Nepal (SEJON), organized a roundtable with 38 economic journalists, editors, and bureau chiefs in Nepal to discuss data use in news organizations. The team also administered an online questionnaire to 28 media professionals (see appendix A for the questionnaire and appendix B for the results). To complement these findings, the World Bank team developed an indicator model to assess the use of data by Nepali news portals based on the methodology proposed by Klein, Galdin, and Mohamedou 2016. The results show that very few news articles indicate the source of data or mention development indicators. However, articles that discuss data, reports, research, statistics, and related topics do critically engage with these ideas.
More than 4,100 articles were analyzed to assess the use of data in media. The data was collected between 9th December 2019 to 9th February 2020. The data source for the model was Nepali news portals that support RSS feeds and are published in English. The news portals that meet these criteria are the Himalayan Times, Onlinekhabar, the Nepali Times, the Telegraph Nepal, the Kathmandu Tribune, and Lokaantar.
The results of the analysis are as follows:
-
Level 1 analysis: The team analyzed whether articles indicated the presence of a data source, a statistical/development indicator, or keywords from papers on statistical capacity–building projects. Examples of keywords included household survey, population census, geospatial data, GDP, GNP, pay gap, trade balance, and unemployment rate. The keywords for data sources are comprised of word sequences of length two and scraped from https://klein.uk/literacy.html. The share of news articles that included at least one keyword that indicated “consistent non-critical” use of data averaged 7.6 percent (scores ranged from 2 percent to 12 percent).
-
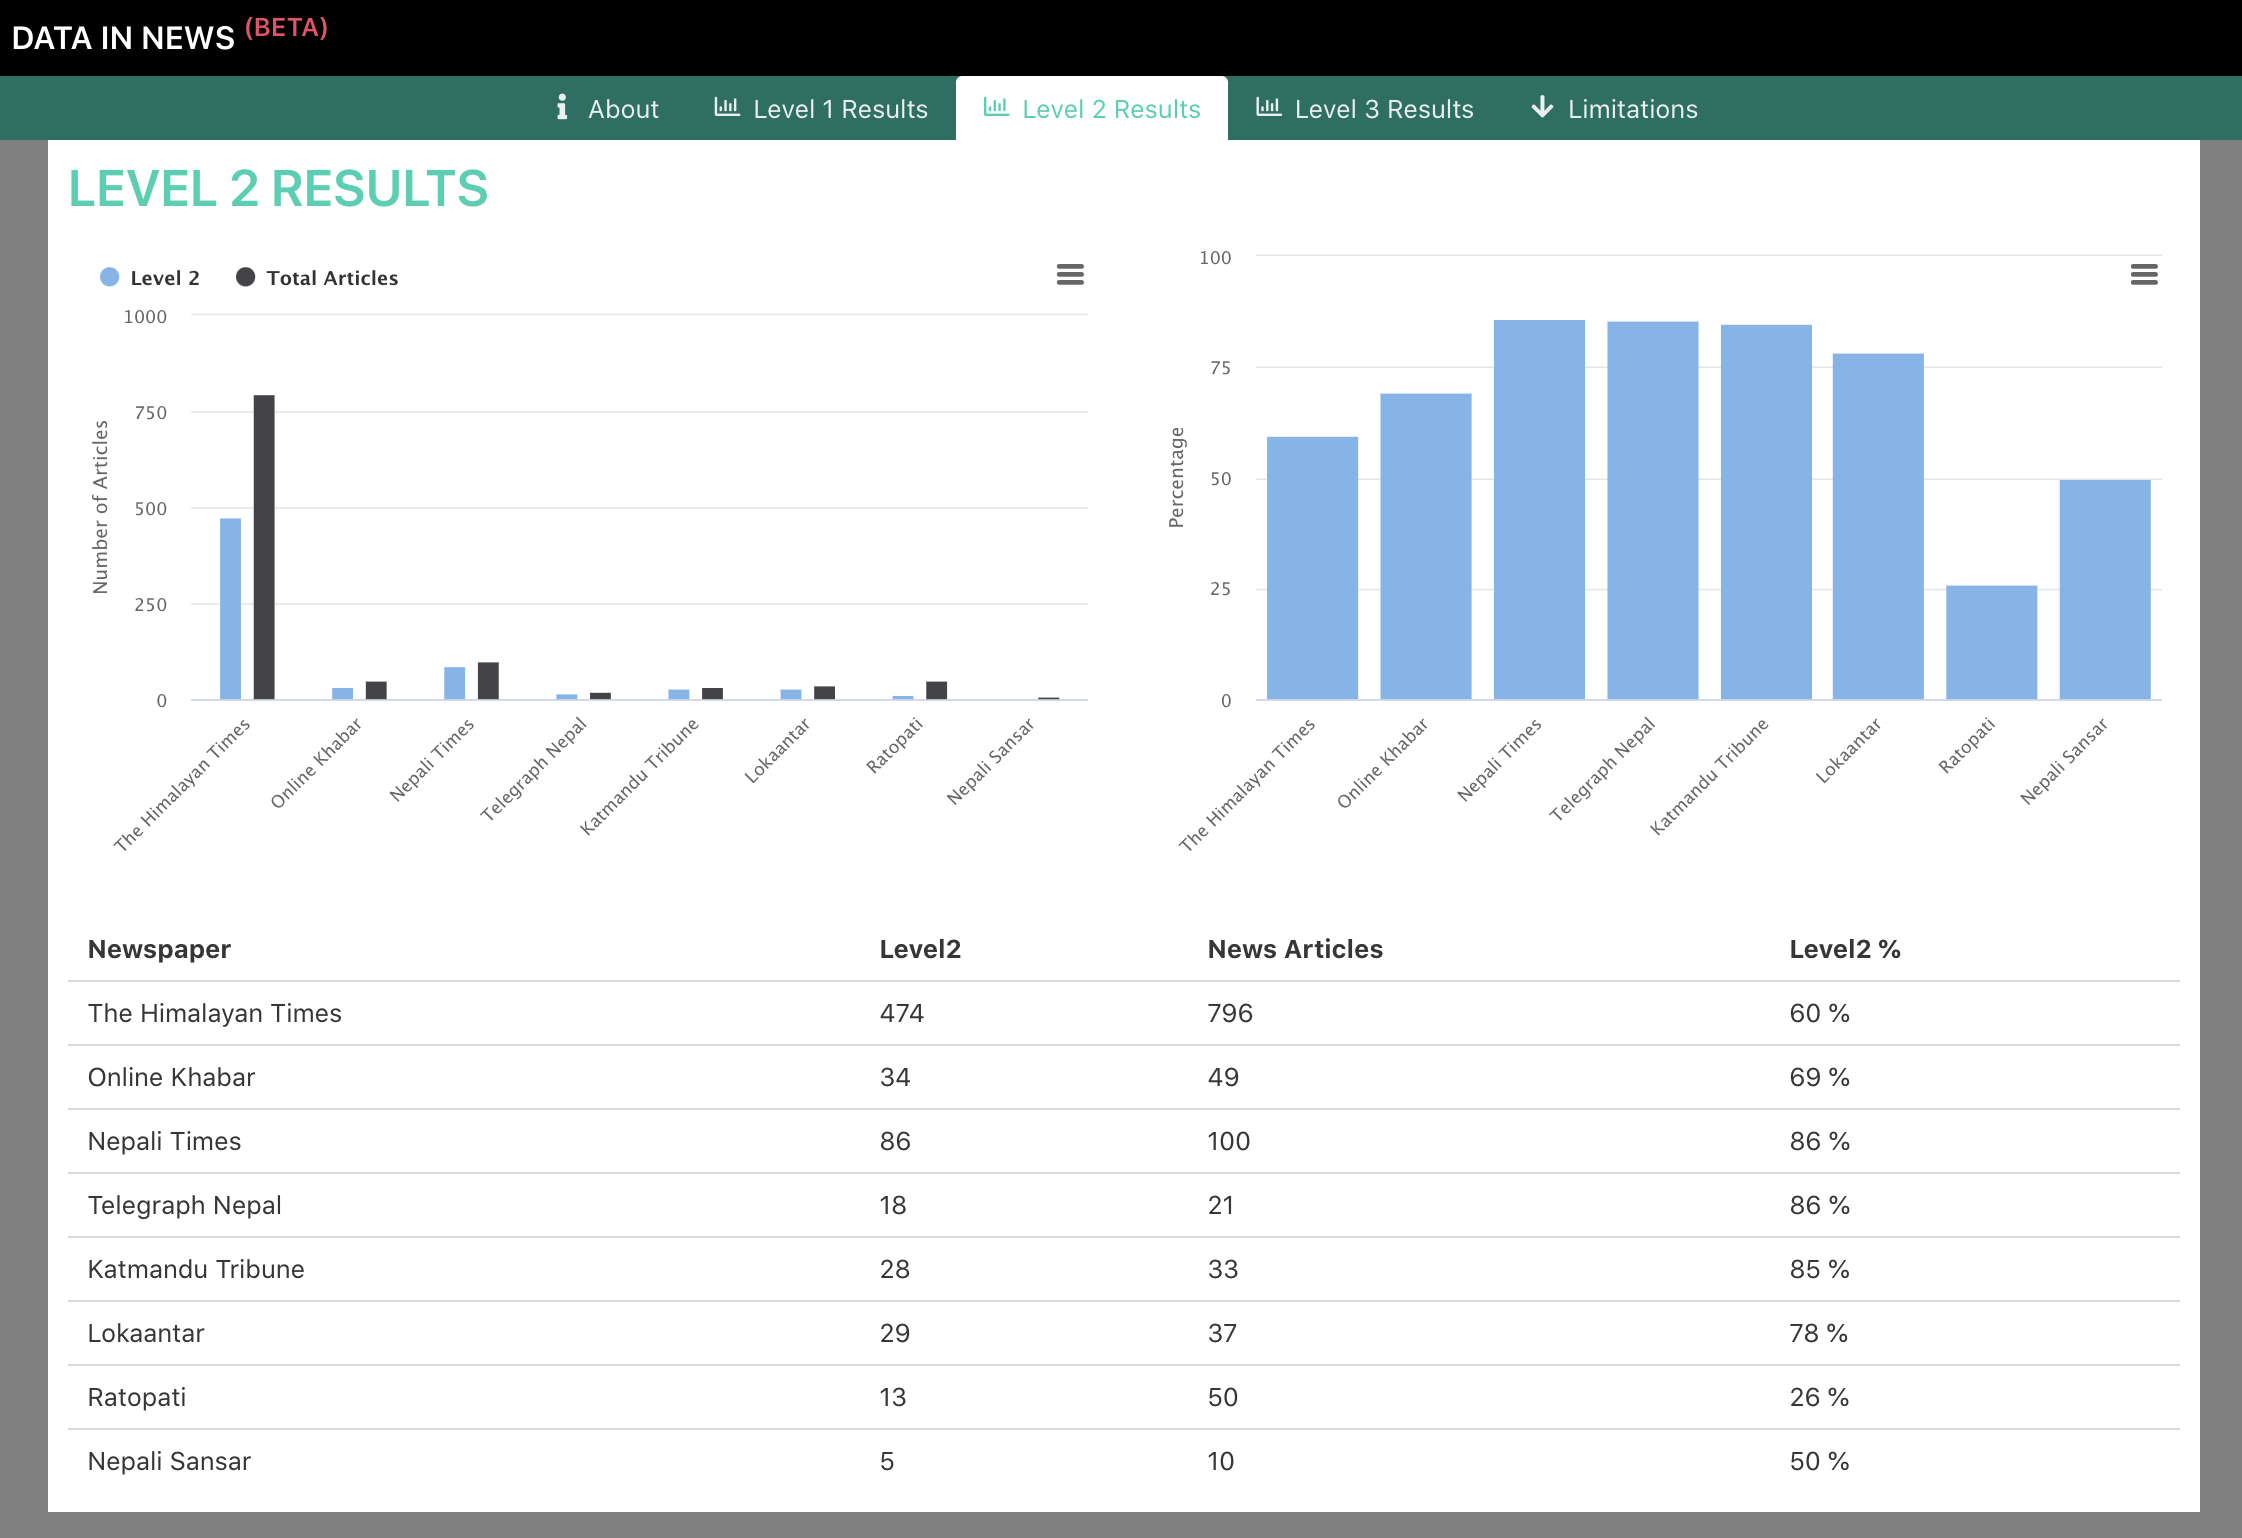
Level 2 analysis: This level of analysis assessed whether an article critically engaged with topics of data or statistics or made arguments by using mathematical concepts. Examples of keywords included ambiguous, error, bias, fake, impartial, precise, scientific, and unreliable Seventeen percent of the more than 4,100 articles studied directly referenced data, records, research, statistics, or studies. Two-thirds of those articles included keywords.
-
Level 3 analysis: “Critical mathematical” use of data occurs when an article indicates questioning or interpreting of data and statistics. Examples of keywords included data manipulation, lead question, report bias, sample select, and sample size. No article met this criterion.