Concept Note on Inclusive Nepal (WIP) and Analysis of usage of Alt text in Nepali newspapers
This is a work in progress
This notebook compiles statistics, resources and insights on:
1. Status of Disability in Nepal
2. Nepali Mobile Apps and Web App penetration
3. Most used Nepali Mobile Apps
3. Most used Nepali Mobile Apps accessibility status
4. Comparitive analysis with other countries
5. Potential Solutions for few apps
6. Prototype and Tools suggestions for Accessibility
7. Published work regarding similar research

Imports
# Pandas
import pandas as pd
#Mapbox
from mapboxgl.utils import *
from mapboxgl.viz import *
Status of Disability in Nepal
df = pd.read_csv("data_sources/disability_2011.csv")
|
District |
Male |
Female |
Population with Disability |
Percentage of PWDs |
| 0 |
Kathmandu |
9144 |
7978 |
17122 |
0.98 |
| 1 |
Morang |
9494 |
7559 |
17053 |
1.77 |
| 2 |
Kailali |
8143 |
7235 |
15378 |
1.98 |
| 3 |
Jhapa |
8466 |
6910 |
15376 |
1.89 |
| 4 |
Chitwan |
6973 |
5964 |
12937 |
2.23 |
df_geojson = pd.read_json('data_sources/map.geojson')
|
type |
features |
| 0 |
FeatureCollection |
{'properties': {'name': 'Humla', 'death': 1}, ... |
| 1 |
FeatureCollection |
{'properties': {'name': 'Darchula', 'death': 2... |
| 2 |
FeatureCollection |
{'properties': {'name': 'Bajhang', 'death': 3}... |
| 3 |
FeatureCollection |
{'properties': {'name': 'Mugu'}, 'geometry': {... |
| 4 |
FeatureCollection |
{'properties': {'name': 'Bajura'}, 'geometry':... |
df.set_index("District", inplace=True)
def add_data(features):
    name = features.get('properties').get('name')
    if (name in df.index):
        percentage = df.loc[name]['Percentage of PWDs']
        population = df.loc[name]['Population with Disability']
        features['properties'] = {'name': name, 'percentage': percentage, 'population':population}
        return features
df_geojson.features.apply(add_data)
0     {'properties': {'name': 'Humla', 'percentage':...
1     {'properties': {'name': 'Darchula', 'percentag...
2     {'properties': {'name': 'Bajhang', 'percentage...
3     {'properties': {'name': 'Mugu', 'percentage': ...
4     {'properties': {'name': 'Bajura', 'percentage'...
                            ...
70    {'properties': {'name': 'Siraha', 'percentage'...
71    {'properties': {'name': 'Saptari', 'percentage...
72    {'properties': {'name': 'Morang', 'percentage'...
73    {'properties': {'name': 'Sunsari', 'percentage...
74    {'properties': {'name': 'Jhapa', 'percentage':...
Name: features, Length: 75, dtype: object
features = df_geojson['features'].values.tolist()
my_dict = {"type":"FeatureCollection", "features":features}
token = "pk................................................................"
viz = ChoroplethViz(my_dict,
                     access_token=token,
                     color_property='population',
                     color_stops=create_color_stops([0, 2500, 5000, 7500, 10000, 12500], colors='YlOrRd'),
                     color_function_type='interpolate',
                     line_stroke='--',
                     line_color='rgb(128,0,38)',
                     line_width=1,
                     opacity=0.8,
                     center=(84, 28.5),
                     zoom=6
                    )
viz.show()
Percentage and Population of disabled in each district of Nepal
viz = ChoroplethViz(my_dict,
                     access_token=token,
                     color_property='percentage',
                     color_stops=create_color_stops([0, 1, 2, 3, 4], colors='YlOrRd'),
                     color_function_type='interpolate',
                     line_stroke='--',
                     line_color='rgb(128,0,38)',
                     line_width=1,
                     opacity=0.8,
                     center=(84, 28.5),
                     zoom=6
                    )
viz.show()
Districts with most number of Disability (Sorted 5)
df.sort_values(['Population with Disability'], ascending=False).head()
|
Male |
Female |
Population with Disability |
Percentage of PWDs |
| District |
|
|
|
|
| Kathmandu |
9144 |
7978 |
17122 |
0.98 |
| Morang |
9494 |
7559 |
17053 |
1.77 |
| Kailali |
8143 |
7235 |
15378 |
1.98 |
| Jhapa |
8466 |
6910 |
15376 |
1.89 |
| Chitwan |
6973 |
5964 |
12937 |
2.23 |
import pandas as pd
from bs4 import BeautifulSoup
from urllib.request import Request, urlopen
import seaborn as sns
site = "https://www.onlinekhabar.com/"
hdr = {'User-Agent': 'Mozilla/5.0'}
req = Request(site,headers=hdr)
page = urlopen(req)
soup = BeautifulSoup(page, "lxml")
image_count = 0
alt_count = 0
collection = soup.findAll("img")
for img in collection:
    image_count = image_count + 1
    if 'alt' in img.attrs:
        alt_count = alt_count + 1
print ("image_count", image_count)
print ("alt_count", alt_count)
print ("alt_count_percent", alt_count/image_count*100)
image_count 154
alt_count 1
alt_count_percent 0.6493506493506493
df = pd.read_csv('data_sources/news_portals.csv')
|
Portal |
Link |
| 0 |
Online Khabar |
https://www.onlinekhabar.com/ |
| 1 |
eKantipur |
http://www.ekantipur.com/ |
| 2 |
Setopati |
https://www.setopati.com/ |
| 3 |
The Himalayan Times |
https://thehimalayantimes.com/ |
| 4 |
My Republica |
https://myrepublica.nagariknetwork.com/ |
| 5 |
Nepal News |
https://www.nepalnews.com/ |
| 6 |
Gorkhapatra |
http://www.gorkhapatraonline.com/ |
| 7 |
Nepali Times |
https://www.nepalitimes.com/ |
def alt_counter(site):
    try:
        hdr = {'User-Agent': 'Mozilla/5.0'}
        req = Request(site, headers=hdr)
        page = urlopen(req)
        soup = BeautifulSoup(page, "lxml")
        image_count = 0
        alt_count = 0
        collection = soup.findAll("img")
        for img in collection:
            image_count = image_count + 1
            if 'alt' in img.attrs:
                alt_count = alt_count + 1
        return (alt_count, image_count)
    except:
        return (None, None)
df['alt_count'],df['image_count']=zip(*df.Link.apply(alt_counter))
|
Portal |
Link |
alt_count |
image_count |
| 0 |
Online Khabar |
https://www.onlinekhabar.com/ |
1 |
154 |
| 1 |
eKantipur |
http://www.ekantipur.com/ |
129 |
147 |
| 2 |
Setopati |
https://www.setopati.com/ |
121 |
122 |
| 3 |
The Himalayan Times |
https://thehimalayantimes.com/ |
137 |
138 |
| 4 |
My Republica |
https://myrepublica.nagariknetwork.com/ |
94 |
95 |
| 5 |
Nepal News |
https://www.nepalnews.com/ |
198 |
212 |
| 6 |
Gorkhapatra |
http://www.gorkhapatraonline.com/ |
None |
None |
| 7 |
Nepali Times |
https://www.nepalitimes.com/ |
71 |
74 |
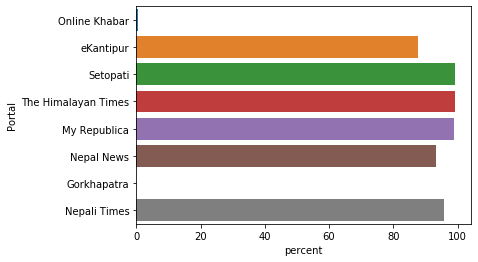
df['percent'] = 100*df['alt_count']/df['image_count']
|
Portal |
Link |
alt_count |
image_count |
percent |
| 0 |
Online Khabar |
https://www.onlinekhabar.com/ |
1 |
154 |
0.649351 |
| 1 |
eKantipur |
http://www.ekantipur.com/ |
129 |
147 |
87.7551 |
| 2 |
Setopati |
https://www.setopati.com/ |
121 |
122 |
99.1803 |
| 3 |
The Himalayan Times |
https://thehimalayantimes.com/ |
137 |
138 |
99.2754 |
| 4 |
My Republica |
https://myrepublica.nagariknetwork.com/ |
94 |
95 |
98.9474 |
| 5 |
Nepal News |
https://www.nepalnews.com/ |
198 |
212 |
93.3962 |
| 6 |
Gorkhapatra |
http://www.gorkhapatraonline.com/ |
None |
None |
NaN |
| 7 |
Nepali Times |
https://www.nepalitimes.com/ |
71 |
74 |
95.9459 |
sns.barplot(y='Portal', x='percent', data=df)