[Paper Exploration] A Unified Approach to Interpreting Model Predictions
Paper Authors: Scott M. Lundberg, Su-In Lee
Code: https://github.com/shap/shap
Original Paper:
Exploration
Problem
- Understanding model predictions is crucial for many applications. However, complex models, like ensemble or deep learning models, (while they usually achieve high accuracy) are generally difficult to interpret.
- Existing interpretation methods lack clarity about their relationships and preferences.
Proposed Solution by Authors
- Introduce a unified framework called SHAP (SHapley Additive exPlanations) for interpreting predictions.
- Assign importance values to each feature for a specific prediction.
- Develop a new class of additive feature importance measures.
- Prove the uniqueness of a solution within this class with desirable properties.
History in Game Theory
Lloyd Shapley

Lloyd Shapley was an American mathematician and economist who made significant contributions to game theory and cooperative game theory. He was awarded the Nobel Prize in Economic Sciences in 2012, along with Alvin E. Roth, for his work on the theory of stable allocations and the Shapley value, which has applications in various fields, including economics, politics, and computer science. Shapley’s pioneering research has had a lasting impact on understanding and solving problems involving cooperation and allocation of resources in competitive environments.
Shapley Value
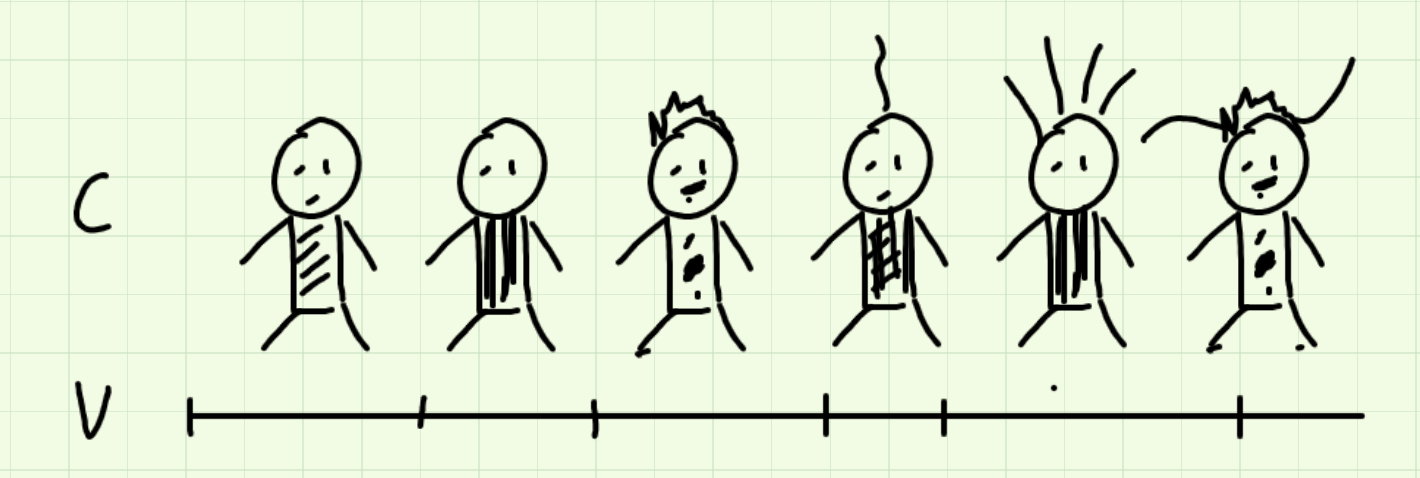
If we have a coalition C that collaborates to produce a value V, how much did each individual member contribute to the final value?
Unfortunately, there will be interaction effect, certain permutation cause members to contribute to more than the sum of their parts.
The Shapley value is a concept from cooperative game theory introduced by Lloyd Shapley. It is used to fairly distribute the value or payoff created by cooperation among a group of participants. The Shapley value provides a unique way to allocate the total value generated by a coalition of players to each individual player based on their marginal contributions to different possible coalitions.
Key characteristics of the Shapley value:
- Fairness: It ensures that each player receives a share of the total value that is proportional to their contribution.
- Symmetry: The Shapley value treats all players equally and satisfies a symmetry property, meaning that if two players have the same contributions to all coalitions, they should receive the same allocation.
- Efficiency: It guarantees that the sum of allocations to all players adds up to the total value generated by all possible coalitions.
Shapley value for member 1:
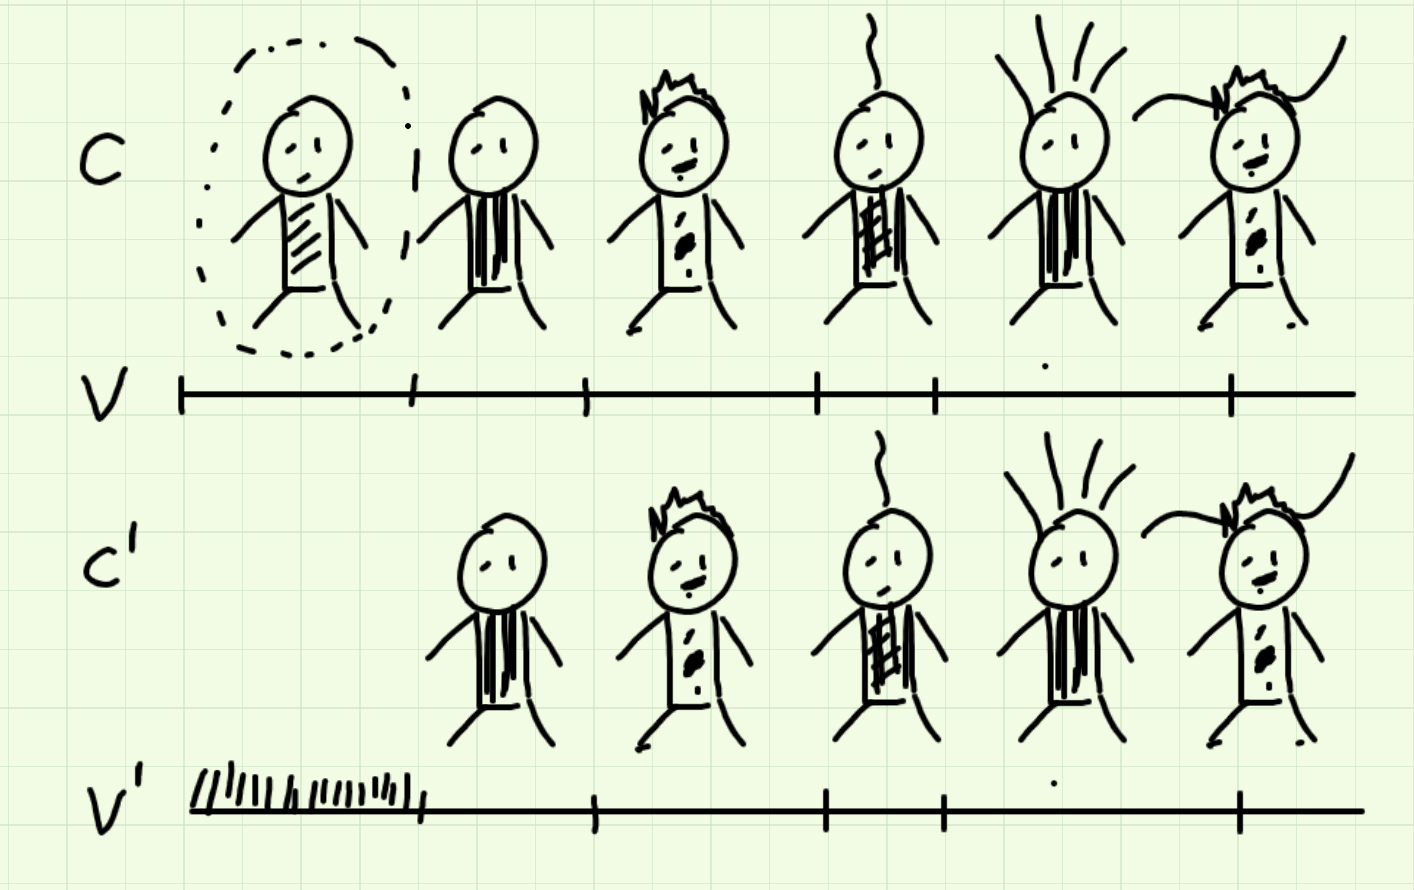
- Sample a coalition that contains member 1, and looking at coalition formed by removing that member.
- Look at the respective values of the coalition, and compare the difference between the two. The difference is the marginal contribution of Member 1 to the group.
- The mean marginal contribution is the Sharpley value.
Mathematically

Machine Learning
Shapley Additive Explanations
The novel unified approach to interpreting model predictions proposed by the authors:
- The perspective of viewing any explanation of a model’s prediction as a model itself (referred to as the explanation model)
- Show that the game theory results guarantees a unique solution to the entire class of additive feature attribution methods, and propose SHAP values as a unified measure of feature importance that various methods approximate.
- Propose new SHAP value estimation methods and demonstrate that they are better aligned with human intuition as measured by user studies.
Additive Feature Attribution Methods
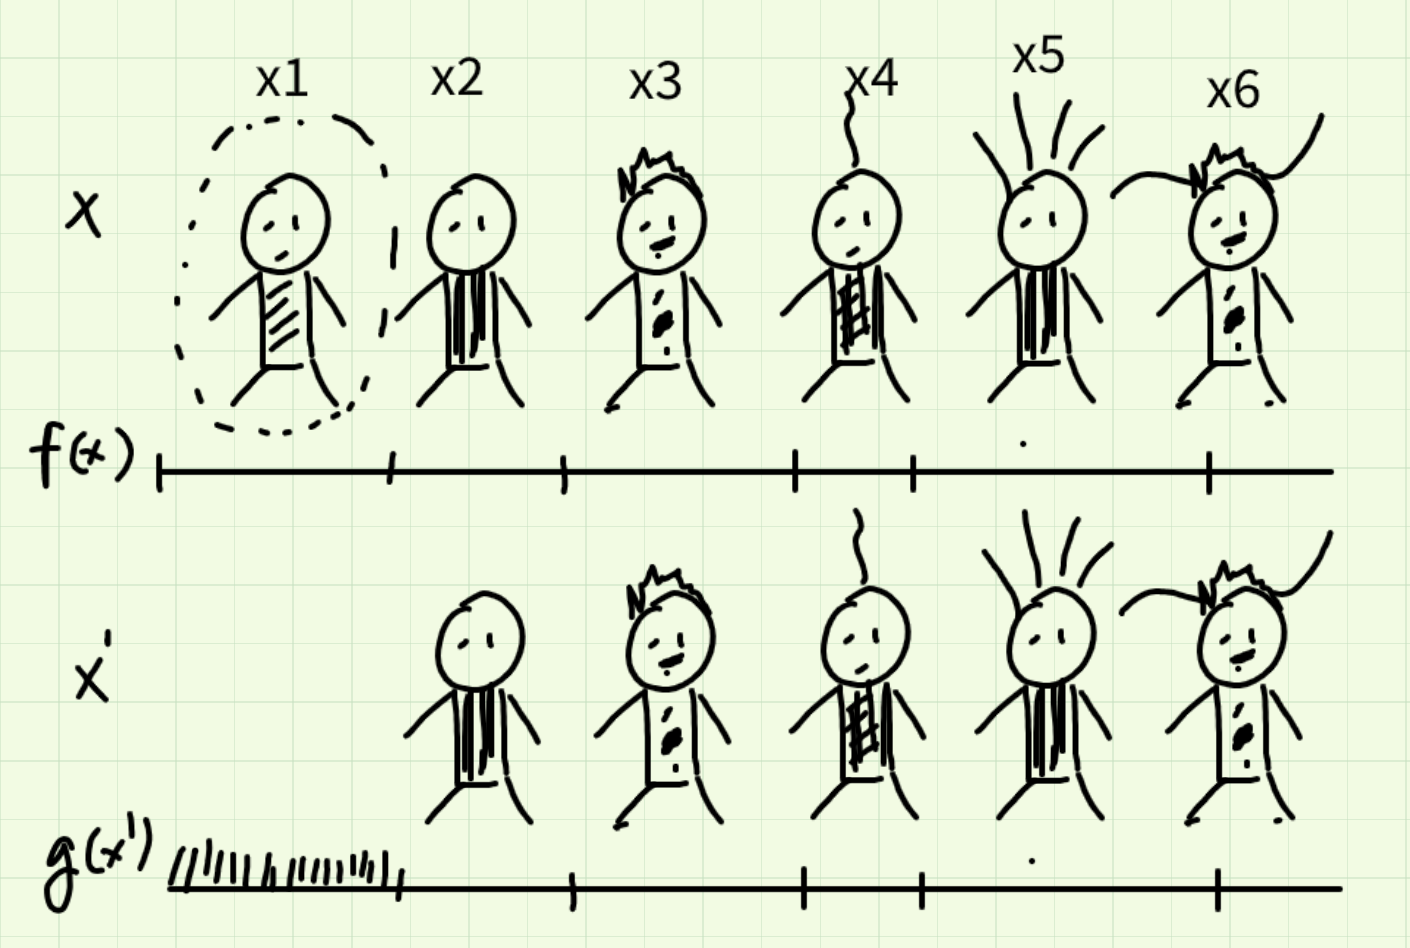
Input: $x$
Model: $f(x)$
Define Simplified local inputs: $f(x)$
Convert feature vector into a discrete binary vector, where feature are either included or excluded
Such that: $g(z^’)$ = $\phi_0 + \sum_{i=1}^M\phi_iz^’_i,$ (explanatory method)
where $z^’ \in \lbrace0, 1\rbrace^M, M$ is the number of simplified input features, and $\phi_i \in R$
$\phi_0$ is the null output, and $\phi_i$ is the explained effect of the $i$ (also known as attribution)
Three properties of Additive feature
Local Accuracy
if $x^’ \approx x$, then $ g(x_’) \approx f(x)$
Missingness
if $x_i^i=0 $, then $ \phi_i=0$
inclusion matters, exclusion should not
Consistency
If feature contribution changes, the feature effect cannot change in the opposite direction.
Shapley Kernel (Model Agnostic)
- approximating Shapley values using fewer samples for efficiency
- computationally efficient
In action
Titanic Survival Prediction using XGBoost, and SHAP
Imports
import numpy as np
import pandas as pd
import xgboost as xgb


from sklearn.model_selection import train_test_split
from sklearn.metrics import accuracy_score
import shap

shap.initjs()

from sklearn.metrics import classification_report

url = "https://web.stanford.edu/class/archive/cs/cs109/cs109.1166/stuff/titanic.csv"
titanic_data = pd.read_csv(url)
titanic_data.head()
| Survived | Pclass | Name | Sex | Age | Siblings/Spouses Aboard | Parents/Children Aboard | Fare | |
|---|---|---|---|---|---|---|---|---|
| 0 | 0 | 3 | Mr. Owen Harris Braund | male | 22.0 | 1 | 0 | 7.2500 |
| 1 | 1 | 1 | Mrs. John Bradley (Florence Briggs Thayer) Cum... | female | 38.0 | 1 | 0 | 71.2833 |
| 2 | 1 | 3 | Miss. Laina Heikkinen | female | 26.0 | 0 | 0 | 7.9250 |
| 3 | 1 | 1 | Mrs. Jacques Heath (Lily May Peel) Futrelle | female | 35.0 | 1 | 0 | 53.1000 |
| 4 | 0 | 3 | Mr. William Henry Allen | male | 35.0 | 0 | 0 | 8.0500 |
titanic_data.drop('Name', axis=1, inplace=True)
Preprocessing
- Select relevant features and handle missing values
- Replace missing values in Age and Fare with their respective medians
- Encode categorical variables like ‘Sex’ and ‘Embarked’ using one-hot encoding
titanic_data["Age"].fillna(titanic_data["Age"].median(), inplace=True)
titanic_data["Fare"].fillna(titanic_data["Fare"].median(), inplace=True)
titanic_data = pd.get_dummies(titanic_data, columns=["Sex"], drop_first=True)
Train Test Split
- Split the dataset into features (X) and the target variable (y)
- Split the dataset into training and testing sets
X = titanic_data.drop("Survived", axis=1)
y = titanic_data["Survived"]
X_train, X_test, y_train, y_test = train_test_split(X, y, test_size=0.2, random_state=42)
XGBoost classifier
clf = xgb.XGBClassifier(objective="binary:logistic", random_state=42)
clf.fit(X_train, y_train)
y_pred = clf.predict(X_test)
Results
print(classification_report(y_pred, y_test))
              precision    recall  f1-score   support

           0       0.87      0.84      0.86       115
           1       0.73      0.78      0.75        63

    accuracy                           0.82       178
   macro avg       0.80      0.81      0.81       178
weighted avg       0.82      0.82      0.82       178
SHAP
explainer = shap.Explainer(clf)
shap_values = explainer.shap_values(X_test)
shap.summary_plot(shap_values, X_test, plot_type="bar")
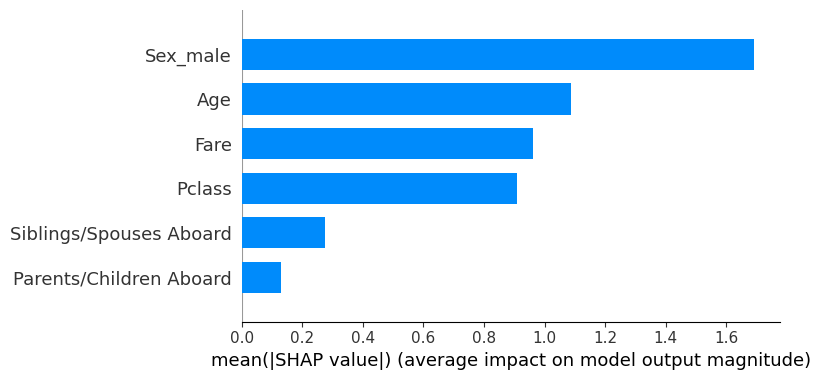
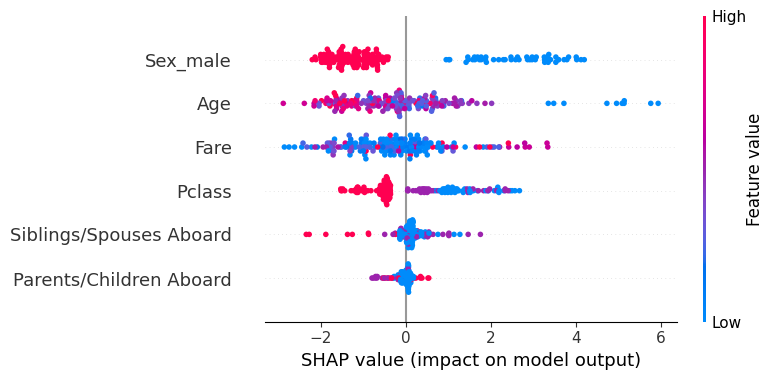
shap.summary_plot(shap_values, X_test)
explainer = shap.Explainer(clf)
shap_values = explainer.shap_values(X_test)
shap.force_plot(explainer.expected_value, shap_values, X_test)
Have you run `initjs()` in this notebook? If this notebook was from another user you must also trust this notebook (File -> Trust notebook). If you are viewing this notebook on github the Javascript has been stripped for security. If you are using JupyterLab this error is because a JupyterLab extension has not yet been written.
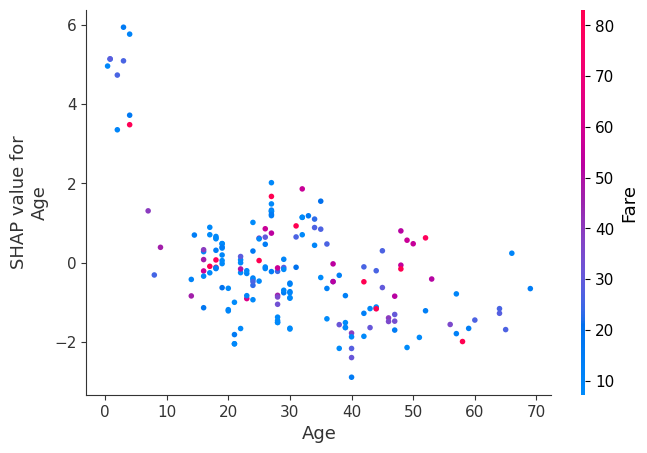
shap.dependence_plot("Age", shap_values, X_test)
Survived
index = 10
X_test.iloc[index,:], y_pred[index], y_test.iloc[index]
(Pclass                      1.00
 Age                        34.00
 Siblings/Spouses Aboard     0.00
 Parents/Children Aboard     0.00
 Fare                       26.55
 Sex_male                    1.00
 Name: 444, dtype: float64,
 1,
 1)
shap.force_plot(explainer.expected_value, shap_values[index,:], X_test.iloc[index], link="logit")
Have you run `initjs()` in this notebook? If this notebook was from another user you must also trust this notebook (File -> Trust notebook). If you are viewing this notebook on github the Javascript has been stripped for security. If you are using JupyterLab this error is because a JupyterLab extension has not yet been written.
index = 11
X_test.iloc[index,:], y_pred[index], y_test.iloc[index]
(Pclass                      2.0
 Age                        40.0
 Siblings/Spouses Aboard     1.0
 Parents/Children Aboard     1.0
 Fare                       39.0
 Sex_male                    0.0
 Name: 667, dtype: float64,
 1,
 1)
shap.force_plot(explainer.expected_value, shap_values[index,:], X_test.iloc[index], link="logit")
Have you run `initjs()` in this notebook? If this notebook was from another user you must also trust this notebook (File -> Trust notebook). If you are viewing this notebook on github the Javascript has been stripped for security. If you are using JupyterLab this error is because a JupyterLab extension has not yet been written.
Did not survive
index = 1
X_test.iloc[index,:], y_pred[index], y_test.iloc[index]
(Pclass                      2.0000
 Age                        25.0000
 Siblings/Spouses Aboard     1.0000
 Parents/Children Aboard     2.0000
 Fare                       41.5792
 Sex_male                    1.0000
 Name: 682, dtype: float64,
 0,
 0)
shap.force_plot(explainer.expected_value, shap_values[index,:], X_test.iloc[index], link="logit")
Have you run `initjs()` in this notebook? If this notebook was from another user you must also trust this notebook (File -> Trust notebook). If you are viewing this notebook on github the Javascript has been stripped for security. If you are using JupyterLab this error is because a JupyterLab extension has not yet been written.
index = 2
X_test.iloc[index,:], y_pred[index], y_test.iloc[index]
(Pclass                      3.0
 Age                        69.0
 Siblings/Spouses Aboard     0.0
 Parents/Children Aboard     0.0
 Fare                       14.5
 Sex_male                    1.0
 Name: 535, dtype: float64,
 0,
 0)
shap.force_plot(explainer.expected_value, shap_values[2,:], X_test.iloc[2,:], link="logit")
Have you run `initjs()` in this notebook? If this notebook was from another user you must also trust this notebook (File -> Trust notebook). If you are viewing this notebook on github the Javascript has been stripped for security. If you are using JupyterLab this error is because a JupyterLab extension has not yet been written.